Thursday, 17 March 2016

Single Prints – Last Buyer / Last Seller in Hidden Trade Locations

Markets turn when the last buyer has bought at a high or when the last seller has sold at a low. With traditional bar charts you only see the low of the bar or the high of the bar. You cannot judge the internal buying or selling that has been apparent inside the bar.


What is the importance of the last buyer / last seller?

It is important because it potentially signals the end of the move. No one wants to buy or sell anymore. The price has gone too high or too low. It is at an extreme.

Think of it in real life terms. Imagine you sell beer. There is a lot of demand so you raise prices, but people keep buying. At some point people have drank a lot of beer and don’t want to drink anymore and by now the price is too high. So you might get 1 or 2 more beer sales before everyone stops buying beer and you find yourself lowering the price to get more interest and get people to buy again.
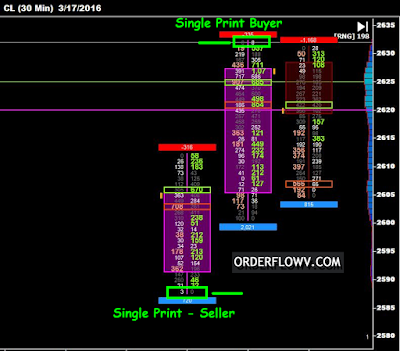

One of the truths about the markets is that when prices go up but people stop buying, prices go down. Sometimes it is quite obvious. You can see it in the Orderflow generated charts.
It works both on short term and medium term charts. It can be used as a scalp trade or a swing trade.
Courtesy - Mike

Friday, 4 March 2016

Introduction of Unfinished Auction and Completed Auction


Unfinished Auction

An “unfinished auction”, sometimes called “unfinished business”, is the  term used to describe when the extreme price for a bar (either high,  low, or both) has both buy AND sell volume. This pattern is only  visible on a Footprint chart because you can “see inside the bar”,  allowing you to see things everyone else misses.

An unfinished auction that occurs on the high tick looks like the  example below. Notice there is both bid and ask volume at the  extreme (high price).

So while at each price there is a battle between buyers and sellers,  the unfinished auction pattern shows that buyers want to take price  higher but are being challenged by sellers. We have found this  pattern creates a huge target for the market to retest usually within  30 minutes. Whether it happens immediately or not, price tends to  come back and test or trade through where the unfinished auction  pattern occurred. That’s why we call this Footprint pattern an  unfinished auction.

Completed Auction

A “completed auction” is when the unfinished auction has been  satisfied. It is satisfied when the price of the unfinished auction  trades again. So the expectation is for price to return to the price  level of the unfinished auction. This typically seems to occur within  30 minutes. The first example below took exactly 30 minutes to  “complete”.


Monday, 2 November 2015

HOW to Choose HIGH ACCURATE Trade Entries ..Live NYMEX CRUDE Trade Room on 02.11.15 Support by NinjaTrder Authorised Ecosystem Partner


Saturday, 31 October 2015

Key elements to decode the Price Order Flow

When it comes to decoding order flow’s there are 3 things traders need to know from an Institutional perspective to trade with the Institutions, instead of against them

1. Trade Location - Where the institutions are most aggressively buying and selling

2. Order Flow - How to follow the institutions as they buy and sell.

3. Trade Management - How to reduce Risk and boost profits while trading with the institutions.
Courtesy - Troy Epperson

Sunday, 18 October 2015

How to measure the signal strenth to get the Right Long Trades on MCX Nickel by Using Ichimoku Clouds on NinjaTrader


Weak Signal - Open 1 lot
Moderate  Signal - Open 2 lot
Strong  Signal - Open 3 lot

Saturday, 17 October 2015

Understand the Order flow Trading

we must first understand why the price moves. Below is a picture of the DOM. The price ladder is the breakdown of resting limit orders between 5 levels indicative buyers (Green) and 5 levels indicative sellers (Red). The price level is marked yellow is the last price paid. In the parentheses, the number of contracts last traded. By reading the flow of orders we are trying to draw attention to shifts in the balance between buyers and sellers, and at an early stage to position ourselves before those who only follow the price, and various price-based indicators, ie majority. Order flow trader trying These forecasts rich no a few seconds ahead, so the method is primarily of interest to intraday speculators


Directional Trading Vs Order Flow Trading - Professional Trade Support by NinjaTrader

Directional Trading Vs Order Flow Trading :


How to define Directional trades meaning that you are going long or short, betting that prices will either move up or down. Therefore if you believe a stocks or commodity will go up, you execute a buy order. If you believe a stocks or commodity will fall, you can sell it, aka “going short.” This type of trading is called directional trading. It is one of the most common forms of trading, that usually many people in the investment world, hedge fund world, and retail speculators engage


Order flow Trading and liquidity is the foundation of every market

Order flow Trading and liquidity is the foundation of every market :

Order Flow Trading is NOT technical analysis or fundamental analysis, although both of those certainly do play a part in order flow analysis.  Why isn’t order flow trading technical or fundamental analysis?  Because technical and fundamental analysis DO NOT always move the market.,because they do not always generate the necessary order flow to move the market.  Sometimes they can move the market, and other times they cannot.  Technical and fundamental analysis are NOT the foundation of every market.  Order flow and liquidity is the foundation of every market.

Many people have experienced losing traders using both technical and fundamental analysis on various occasions.  Why do those losses occur?  They occur because during that particular trade your technical or fundamental (or both) analysis did not generate sufficient order flow to move price in the direction of your trade.  Perhaps you placed a trade with a chart pattern and it failed.  Or perhaps you placed a trade using fundamental analysis, but your stop loss was triggered before your fundamental analysis “kicked in” to move the market in your favor.

Order Flow trading seeks to correct the deficiencies in both technical and fundamental analysis – in order to come up with high probability trading based on the very foundations of every market – order flow and liquidity.  It is the very best, and most profitable way to trade.

Order flow Analysis Concept - Professional NinjaTrader Training to understand the concepts of Order flow Trading for Indian Futures Market

Order flow analysis.. It refers to how the orders are coming into the market, how they are being filled; whether executing at the offer or on the bid. It is the dual auction at the most micro-level. Assessing order flow in real time can tell the trader how trade is being facilitated in any direction, a key concept in auction market theory.